E. EVOLUTION:
Evolution is the process by which a lineage of organisms is modified through time. When modification becomes extensive, new species may arise. Processes and patterns of evolution have been the focus of study by biologists and paleontologists for more than a century. This work has established the fact of evolution, and its general attributes, but many details concerning evolutionary mechanisms are hotly debated in the scientific literature. Analysis of fossils is a powerful tool in the study of evolution. Such work is particularly valuable in establishing the course of evolution, in recognizing the rate of evolutionary change, and in identifying the causes of evolution.
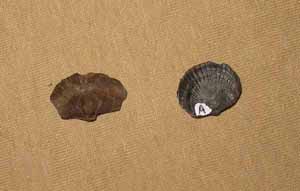
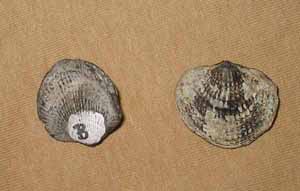
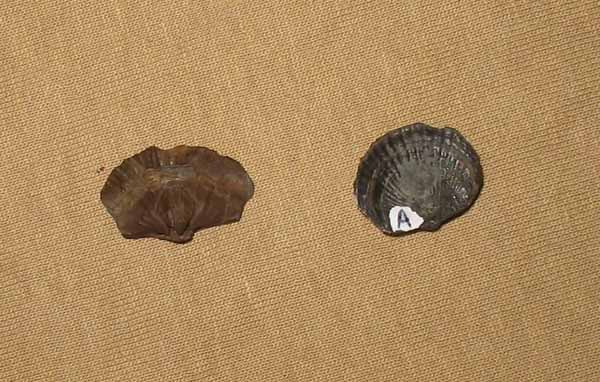
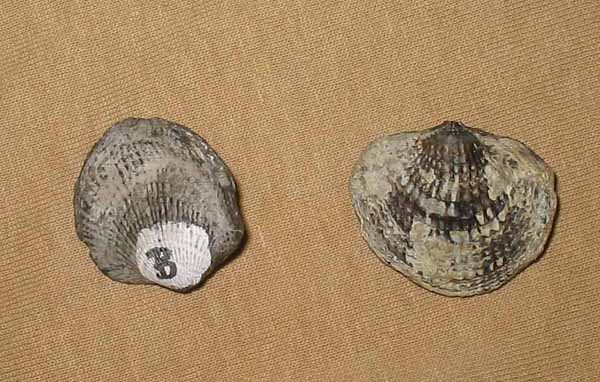
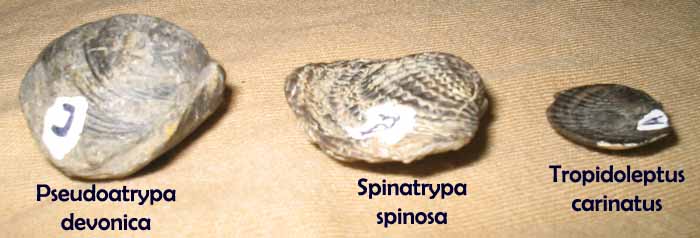
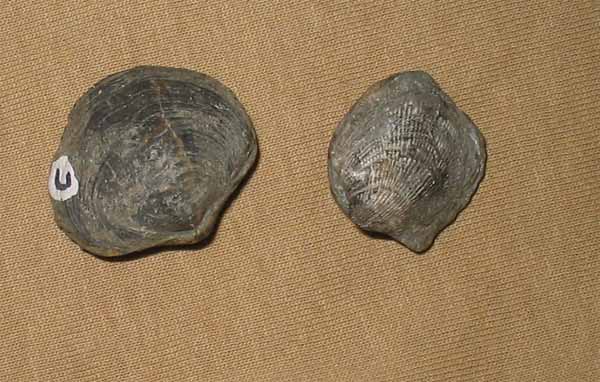
E1. DEVONIAN BRACHIOPODS: In the large specimen tray labeled “EVOLUTION”, you will find specimens of three different species of fossil brachiopods of middle Devonian age from upstate New York. Brachiopods are clam-like invertebrates which were very common in Paleozoic marine ecosystems, but have now become quite rare, and are not often encountered in modern marine environments. Each species is in its own small tray. The three species represent different stages of an evolutionary lineage. Tropidoleptus carinatus is the founder of the lineage. It gave rise to Spinatrypa spinosa, and this species in turn produced Pseudatrypa devonica.
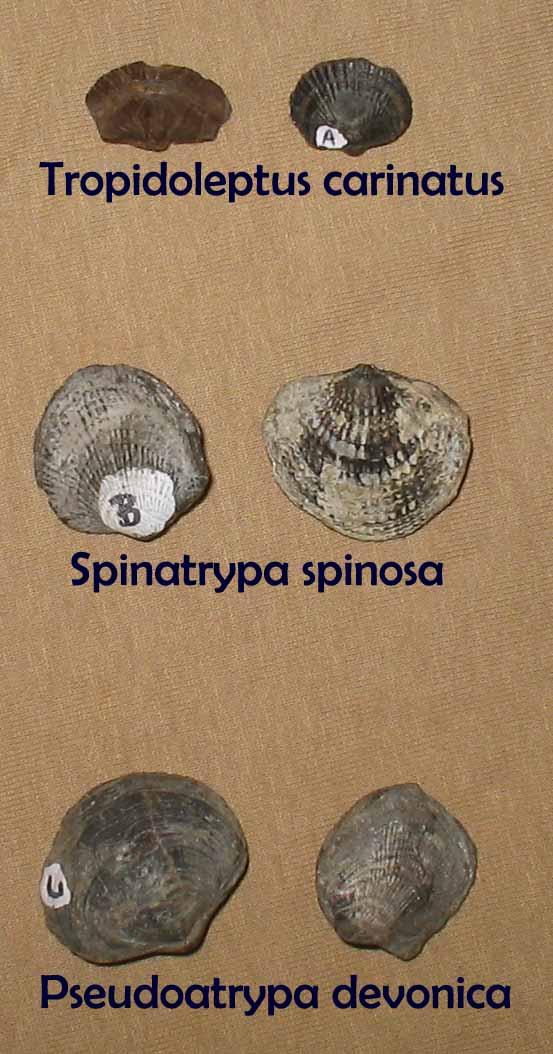
Thus, there are two speciation events represented in this lineage: 1) T. carinatus – S. spinosa; and 2) S. spinosa – P. devonica. Figure 3.9 shows the geologic context in which these species are found. The sketch is a profile view of a roadcut 30 miles southwest of the city of Rochester, in Monroe County, NY.
Each species is confined in its occurrence to a specific zone within the sequence of rock layers (stratigraphic sequence) identified in Figure 3.9. Specimens of a particular species occur only within its zone, and not elsewhere in the stratigraphic sequence. This is because a species originates at the base of its zone, and becomes extinct at the top of its zone. The fossiliferous zones are observed to overlie one another in a simple vertical sequence. Notice that the radiometric ages of horizons within this sequence are also given in the figure.
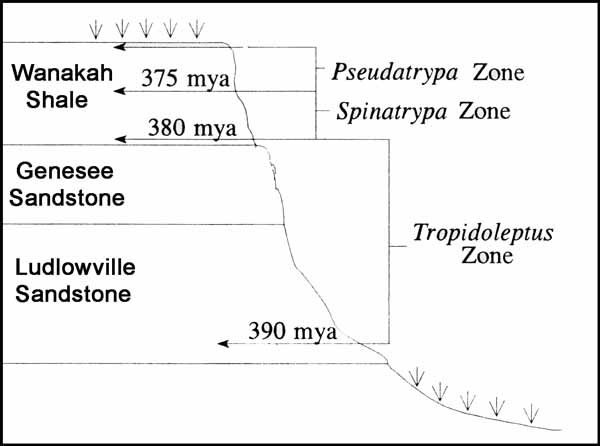
FIGURE 3.9: Stratigraphic occurrence of three atrypid brachiopod
species in rocks of middle Devonian age, western New York.
Radiometric
ages are for the first occurrence of each species.
E1.1 Paleoenvironment: It is clear from Figure 3.9 that these species are found in different types of rock. T. carinatus occurs in sandstone, and the other two species occur in shale. This distribution has important environmental implications because the physical characteristics of a rock are the products of the environment in which it formed. Thus, rock type is an index of paleoenvironment, i.e., the environment in which a fossil species lived. Sandstones, for example, are generally indicative of environments with clean, clear water, fast-moving currents or waves, and hard, sandy substrates. Shales indicate environments with turbid water, little current activity, and soft, muddy substrates.
The changeover in sediment type from the lower sandstone units in Figure 3.9 (Ludlowville and Genesee Sandstones) to the Wanakah Shale imply that a significant changes in environment occurred during the interval represented by this stratigraphic section. Where in the section did this environmental change occur?
WITHIN THE SANDSTONE ________________
WITHIN THE SHALE ________________
BETWEEN SANDSTONE & SHALE _______________
E2. BRACHIOPOD SHELL GEOMETRY: To more clearly understand the evolution of these brachiopods, we will need to analyze their shell shapes using the parameters defined in Figure 3.10.
E2.1 Measure the length and height of each species (one specimen of each will do) using the definitions for these terms given in Figure 3.10. Also calculate shell fineness using the equation given in Figure 3.10. Record your data in the first three columns of Table 3.8.
E2.2 Geologic Age: We will define the geologic age of these brachiopod species as the time of their first appearance in the stratigraphic record. Geologic age for each species may be obtained from the data in Figure 3.9. Enter in the appropriate spaces in the last column of Table 3.9, the geologic age, i.e. the age of first occurrence, for each of the brachiopod species, as determined from Figure 3.9.
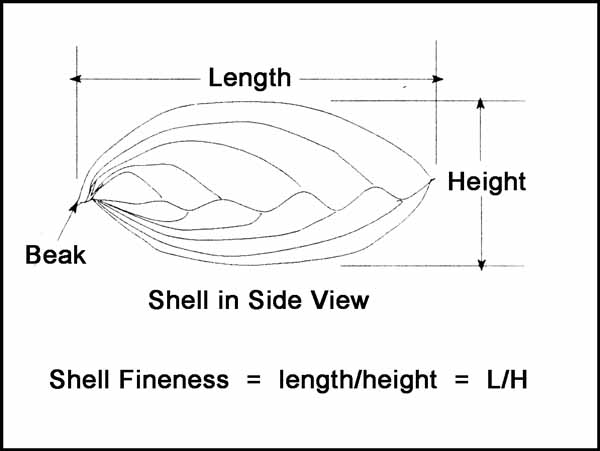
Figure 3.10: Definition of Geometric Parameters Used In Measuring Brachiopod Shells
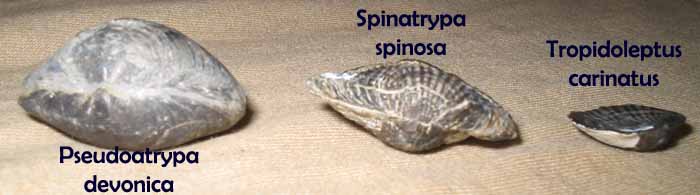
TABLE 3.8: Geometric and age data for three species of atrypid brachiopods
SPECIES
|
Shell Length (cm) |
Shell Height (cm) |
Shell Fineness (L/H) |
Geologic Age (mya) |
|
|
|
|
|
| T. carinatus | ||||
|
|
|
|
|
| S. spinosa | ||||
|
|
|
|
|
| P. devonica |

E3. SCALE OF EVOLUTIONARY CHANGE: The data in Table 3.8 can be used to examine the scale of evolutionary change in shell shape in this brachiopod lineage. This may be done by subtracting the shell fineness value of the species produced in each of the two speciation events of interest (daughter species) from the shell fineness of the ancestral form in each speciation (ancestor species). Perform this calculation and enter the results in Table 3.9.
E3.1 In the last column of Table 3.9, note whether the magnitude of the change in shell fineness is large or small by placing an X in the appropriate space.
TABLE 3.9: Data on scale of evolutionary changes in shell fineness
Speciation Event
|
Ancestor Species |
Daughter Species |
Evolutionary Change in Fineness |
Scale of Evolutionary Change
Large Small |
|
#1
|
T. carinatus |
S. spinosa |
|
|
|
#2
|
S. spinosa |
P. devonica |
|
|
|
E4. RATE OF EVOLUTIONARY CHANGE: We can now estimate the rate of evolutionary change in shell fineness in these brachiopods from the data contained in Table 3.8. A graphical approach is simplest. Use the graph axes shown in Figure 3.11, as a basis for conducting your analysis.
E4.1. First plot the position of each species in Figure 3.11 with respect to shell fineness and geologic age. In doing this, remember that for each species, age is the X-coordinate, and is located with respect to the X (age) axis; and that fineness is the Y- coordinate, and is located with respect to the Y (fineness) axis. When finished, you should have three data points drawn in Figure 3.11, one for each species. Label each data point with the appropriate species name.
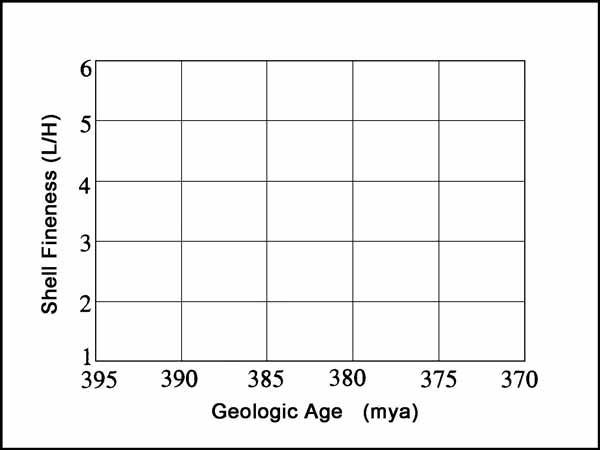
FIGURE 3.11: Rate of evolutionary change in shell fineness for a lineage of atrypid brachiopods.
E4.2. Connect the three data points in Figure 3.11 by drawing straight lines between them. You will thus obtain two lines, one connecting T. carinatus with S. spinosa, and the other connecting S. spinosa with P. devonica. The first line represents the speciation of S. spinosa from T. carinatus (Speciation #1). The second line represents the speciation of P. devonica from S. spinosa (Speciation #2).
E4.3. Evolutionary Rate: The slopes of the two lines in Figure 3.11 are an index of evolutionary rate. Lines that are nearly horizontal indicate slow rates of change, while steeply lines represent rapid rates of change. How do the two speciation events listed in Table 3.10 compare with respect to rate of change in shell fineness? Note your conclusions in Table 3.10 by placing an “X” in the appropriate spaces of the last column of this table.
TABLE 3.10: Summary of evolutionary rates for a lineage of atrypid brachiopods.
Speciation Event
|
Ancestor Species |
Daughter Species |
Rate of Evolutionary Change
Fast Slow
|
|
#1
|
T. carinatus |
S. spinosa |
|
|
#2
|
S. spinosa |
P. devonica |
|
|
E5. EVOLUTIONARY CAUSATION: It is possible to gain some understanding of the causes driving the evolution of this lineage of brachiopods by combining our observations on the following: scale of evolutionary change (Table 3.9); evolutionary rates (Table 3.10); geologic setting (Figure 3.9); and paleoenvironment (Question E1.1). Use Table 3.11, below, as a guide in assembling these data. To do this, follow the instructions E5.1 through E5.4, below.
TABLE 3.11: Evolutionary data for a lineage of atrypid brachiopods.
Speciation Event
|
Evolutionary Scale |
Evolutionary Rate |
Rock Type |
Paleo Environment |
#1
|
|
|
|
|
#2
|
|
|
|
|
E5.1 Evolutionary Scale: Transfer data ( i.e., the terms large or small) from the last column of Table 3.10 to the first column of Table 3.11.
E5.2 Evolutionary Rate: Transfer data ( i.e., the terms fast or slow) from the last column of Table 3.10 to the second column of Table 3.11.
E5.3. Rock Type: This term refers to the type of rock in which a species occurs. Enter the term same in the third column of Table 3.11, if both ancestor and daughter species occur in the same type of rock, as determined from Figure 3.9, and different if they occur in different rock types.
E5.4. Paleoenvironment: In the fourth column of Table 3.11, enter the term same if both ancestor and daughter species lived in the same type of paleoenvironment, as determined from question E1.1, and different if they lived in different paleoenvironments.
E5.5. Causes of Speciation: New species arise in two different environmental scenarios: 1) adaptation to changing environments (Type 1 speciation; and 2) progressive adaptation within a constant environment (Type 2 speciation). In the first case, a lineage produces new species when confronted by changing environmental conditions. The new species thus produced generally exhibit new adaptations which make it possible for them to survive in the new environment. In the second case, a lineage produces new species within the context of an unchanging, constant environment. The new species generally exhibit improved adaptive designs that render them more efficient and effective competitors within this environment.
E5.6. Using the information in Table 3.11 and in E5.5, briefly discuss the probable cause of speciation in these brachiopods. Pay particular attention to whether the appearance of each new species was a Type 1 or Type 2 speciation event as defined in E5.5.
Speciation #1 ( T. carinatus/S.spinosa ): ____________________________________________
Speciation #2: (S . spinosa/P. devonica ): ____________________________________________
What is the likely explanation for the difference in evolutionary rates between the speciation that produced S. spinosa , and the speciation that produced P. devonica ?
E5.7. Adaptive Significance of Evolutionary Change in Shell Shape: Brachiopods are filter-feeders, which means that they extract tiny organisms and organic particles from the water in which they live. They do this by generating a current which draws food-laden water into their shells where it is passed through a filtration net, and the food particles removed. Studies with modern brachiopods show that even a small amount of sediment entering the shell with the incoming current can clog this filtration system and kill the animal. Thus, brachiopods must either live in environments with clear water, or adopt shell shapes which minimize sediment influx into their shells.
Consider the environments, as described in E1.1, in which our Devonian brachiopods were living. T. carinatus inhabited clear-water, sandy environments where clogging probably was not much of a problem. More significant a factor in terms of determining shell form were strong currents, which are common in sandstone paleoenvironments. The flattened, streamlined shell shape of Tripidoleptus probably functioned to minimize the flow-induced forces acting to dislodge it from the substrate. On the other hand, as indicated by their association with shale, both S. spinosa and P. devonica inhabited muddy-water environments with soft, mud bottoms, where currents, if any, moved only very slowly. For these brachiopods, clogging must have been a major problem. The rounded, globular shapes of their shells served to anchor them in the soft substrate, and keep the margins of the shell clear of the bottom, so that when the shell was opened, the mud in which they sat would not be drawn into the shell.
Considering these functional aspects of brachiopod shell shape, discuss the adaptive significance of changes in shell form associated with the two speciations of interest.
Click here to go back to go back to the main page
Department of Geology
Brooklyn College
Brooklyn, NY 11210